KPI widget
Configuring KPI widget
-
From the right side of the widget generation page, click the Update Widget Column Configurations icon.
-
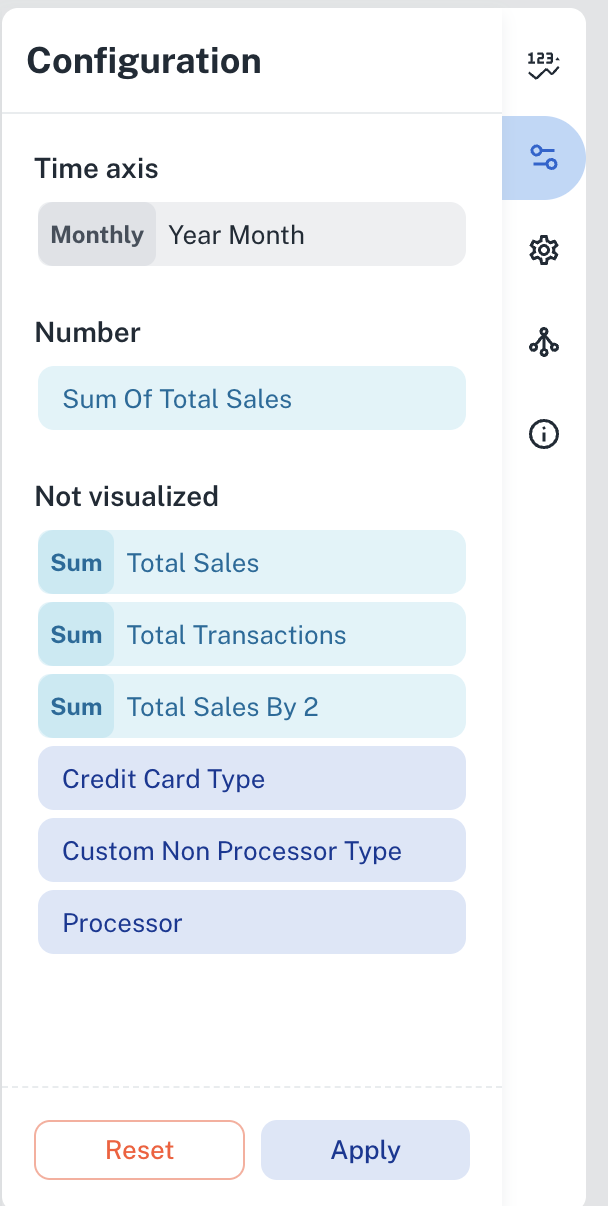
Configure any of the following:
| Items | Description |
|---|---|
| Time axis | Click the field and change the title of the Time axis. |
| Number | Click the field and you can change the following:
|
| Not Visualized | Drag and drop items in this section into the Number section to view the KPI in the canvas region. |
Setting KPI widget
- From the right side of the widget generation page, click the Update settings icon.
- Set the following:
| Item | Description |
|---|---|
| General | Set general details. |
| Title | Edit the title of the chart. |
| Subtitle | Edit the subtitle of the chart. |
| Help message | Type the message that appears when you hover over the help icon. |
| Number | Set the details of the displayed KPI. |
| Numeric Notation | Select how numerical values are displayed:
|
| Decimal Points | Specify the number of digits to display after the decimal point. |
| Show Date | Displays the date corresponding to the selected KPI period in the KPI widget. |
| Indicator | Set the details of the KPI trend comparison results. |
| Numeric notation | Select how numerical values are displayed:
|
| Decimal points | Specify the number of digits to display after the decimal point. |
| Show Date | Displays the date corresponding to the KPI comparison results period. |
| Positive color | Specify the color to display if the KPI is trending positively. |
| Negative color | Specify the color to display if the KPI is trending negatively. |
| Spark line | Select the check box to enable the Spark line or the Area chart that displays in the KPI widget. |
| Positive color | Specify the color to display if the KPI is trending positively on the Spark line. |
| Negative color | Specify the color to display if the KPI is trending negatively on the Spark line. |
| Linked reports | Set the details of the dashboard reports you want to view from this widget. |
| Linked report URL | Paste the URL of the dashboard that you want to view from this widget. |
| Open in New tab | Specify if you want to view the linked report in a different tab. |
Setting period comparison for KPI widgets
Period comparison in KPI widgets allows you to analyze data trends by comparing current and previous timeframes (e.g., month-to-month, quarter-to-quarter, year-to-year). DataGOL displays the current and previous period's metric value and the percentage change, enabling quick identification of performance fluctuations, seasonal trends, and the impact of various factors. For instance, a sales manager can compare this month's revenue to last month's, or a financial analyst can assess year-over-year growth. Highlighting these changes helps users identify issues or adjust strategies based on performance.
To perform KPI period comparison, do the following:
-
Select the specific metric in the workbook that you wish to analyze. This could be sales revenue, customer acquisition cost, website traffic, or any other relevant key performance indicator and create a visualization.
-
Apply a date filter to specify the period you want to analyze (e.g., Last Month, Last Quarter, Last Year). The KPI is displayed.
-
In the KPI configuration settings, click the metric and then the Comparison Criteria option and select the desired comparison period:
-
Previous Period: Compares the selected period with the immediately preceding period of the same duration (e.g., this month vs. last month, this year vs. last year).
-
Year period: Compares the selected year with the previous year. The system will display the metric's value for the selected period and the comparison period, along with the percentage change.
-
Was this helpful?